
Executive Reporting & Analytics — Portfolio
Illustrative solution concept · Synthetic information · Not a client engagement
Executive analytics
A clear view, with definitions you can trust
Compare synthetic quarters and segments with traceable calculations.
Explore executive analytics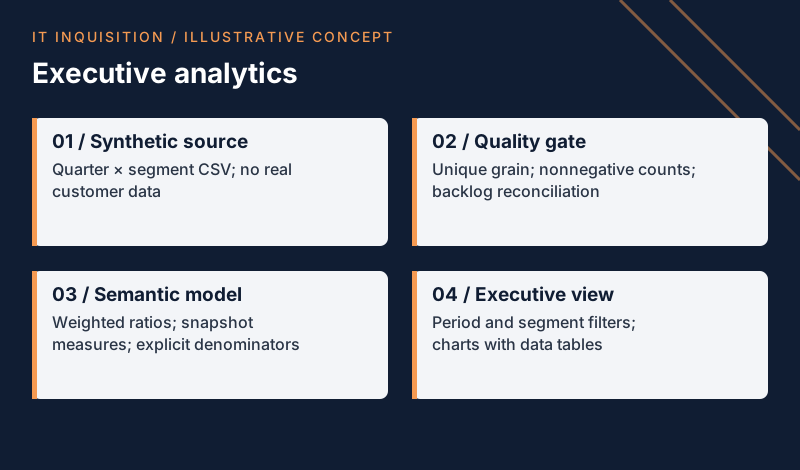
For an organization that needs consistent executive reporting with transparent definitions.
Proposed solution
A clear view, with definitions you can trust. This illustrative design makes responsibilities, evidence and exception handling explicit. It is a possibility to adapt through discovery, not a claim of a completed engagement.
Technologies and methods
Dimensional modeling; weighted aggregation; metric definitions; lineage and reporting governance.
Intended business benefits
Clearer decisions, accountable handoffs and usable information. Validate these hypotheses against an agreed baseline; no measured customer results are presented.
Explore the solution design
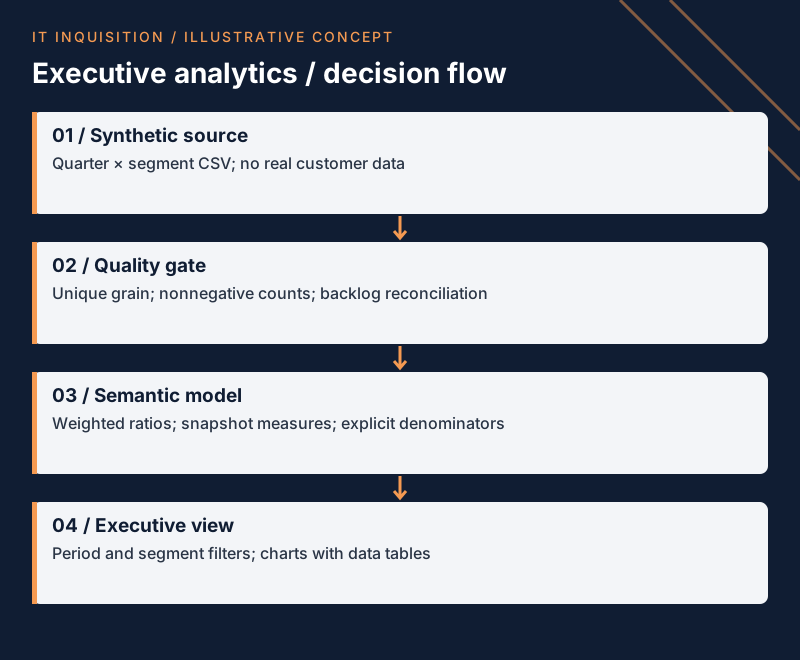
| Stage / boundary | Meaning |
|---|---|
| Synthetic source | Quarter × segment CSV; no real customer data |
| Quality gate | Unique grain; nonnegative counts; backlog reconciliation |
| Semantic model | Weighted ratios; snapshot measures; explicit denominators |
| Executive view | Period and segment filters; charts with data tables |
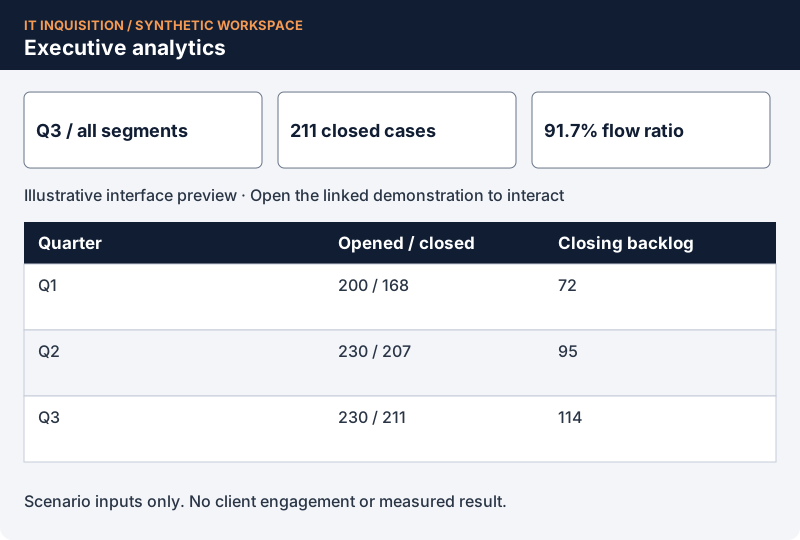
Preview the experience
Take a closer look
Open the interactive experience to inspect the synthetic scenario, then review the supporting samples.
Your next mission
Discuss the work ahead.
Define the business challenge, the people affected, and the decisions you need to make.